OpenTelemetry 요청 추적
요청마다 Trace ID 하나를 부여하여 traceparent 헤더로 전파하면 여러 서비스의 Span이 하나의 흐름으로 연결된다.
문제 정의
요청 하나가 여러 서비스를 경유하면 로그도 서비스별로 분산된다. 어느 로그 줄이 같은 요청에서 생성되었는지 시각만으로는 대응시키기 어렵다.
Trace와 Span
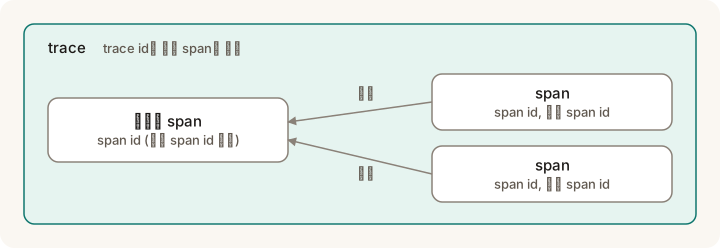
- span: 작업 하나를 나타내는 단위이다. 자신의 span id를 가지며, 최초의 span이 아니면 부모 span id도 가진다.
- trace: trace id가 같은 span의 집합이다.
서비스 간 전파
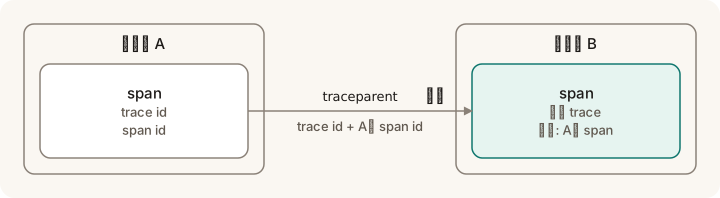
서비스 A가 B를 호출할 때 trace id와 자신의 span id를 traceparent 헤더에 포함하여 전송한다. B는 그 값으로, 같은 trace에 속하면서 A의 span을 부모로 하는 span을 생성한다. 헤더의 형식은 W3C Trace Context가 규정한다.
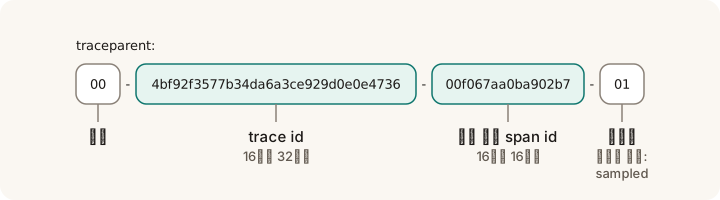
traceparent: 00-4bf92f3577b34da6a3ce929d0e0e4736-00f067aa0ba902b7-0100: 버전- 16진수 32자리: trace id
- 16진수 16자리: 호출 측의 span id
01: 플래그. 마지막 비트는 호출 측이 기록했을 수 있음을 나타내는 표시(sampled)이다.
최소 예제
from opentelemetry import trace
from opentelemetry.propagate import inject
from opentelemetry.sdk.trace import TracerProvider
from opentelemetry.sdk.trace.export import BatchSpanProcessor, ConsoleSpanExporter

provider = TracerProvider()
# 끝난 span을 콘솔로 내보낸다
provider.add_span_processor(BatchSpanProcessor(ConsoleSpanExporter()))
trace.set_tracer_provider(provider)
tracer = trace.get_tracer("demo")

with tracer.start_as_current_span("order"):
    with tracer.start_as_current_span("stock"):
        headers = {}
        # 지금 span의 정보를 traceparent 헤더로 넣는다
        inject(headers)
        print(headers)
콘솔에 span 두 개가 JSON으로 출력된다. 두 span의 trace_id는 같고, stock의 parent_id는 order의 span_id이다.